Client Login
 Contact
TS Lombard’s Head of Strategy Andrea Cicione recently published an extremely useful piece of analysis designed to answer four crucial questions for investors:
- Where are we in the Covid-19 crisis?
- How bad will it get?
- What signposts should investors look for to spot the bottom?
- What will the recovery look like?
At TS Lombard we have been making a tremendous effort in recent weeks to tackle these issues and explain to macroeconomics – and macro strategy – of the coronavirus. Andrea’s answers draw extensively on this research. So let's tackle each one in turn:
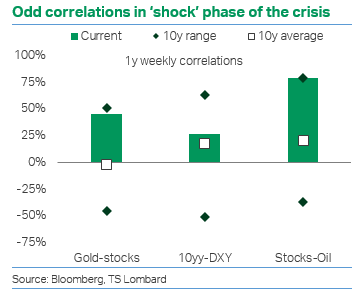
- Where are we in the Covid-19 crisis? We recently produced a COVID-19 ‘roadmap’, which outlines the three main phases to the crisis: (i) the shock, (ii) the macro consequences and (iii) the post-virus period (a ‘new normal). Our analysis suggests we are still in the first phase, but there are already signs we are transitioning to the second. The shock stage is characterized by high volatility in markets and unusual correlations – as an old hand I worked with in the past used to say, in a crisis all correlations go to one. Yet volatility seems to have peaked and correlations are normalizing.
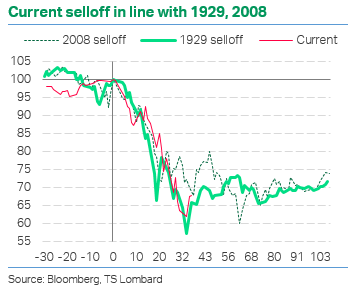
 A historical comparison seems to support this conclusion. The selloff in equities in this crisis has been as violent as the selloffs in the historically most volatile periods of 2008 and 1929. Once the liquidation phase is over, better efforts at price discovery by investors should follow. This does not mean that markets will have bottomed: in 1929, after the initial 35% drop (which, incidentally, was followed by a 25% rally), the S&P 500 dropped another 80%. But the decline became a lot more gradual, as investors more rationally priced in the incoming bad news.
 - How bad will it get? As we move into the ‘consequences’ phase in the next few weeks, we expect markets to settle near ‘fair value’ levels. However, this natural process will be influenced by policy action – sometimes temporarily, sometimes permanently. For instance, central banks buying specific assets – including government and corporate bonds – in an open-ended fashion will distort market pricing for as long as such programmes last. Yet, so far, policymakers have resisted the urge to buy equities. So this is the asset class that is most likely to settle close to its fair value.
 S&P 500 is significantly above fair value. Taking the S&P 500 as an example (the de facto global benchmark), we think the index is still trading significantly above fair value. Over the past few weeks, we have been estimating how much we expect earnings to decline in 2020 based on US GDP forecasts by our economists. These predictions are constantly being revised as new information comes in, especially with regard to government-imposed lockdowns and quarantines. In light of our latest nominal GDP estimates, we think that EPS (12-month forward) could drop by as much as 30%. Assuming a conservative 15.5-16.0 p/e, this implies a fair value range for the S&P 500 of 1600-1800.
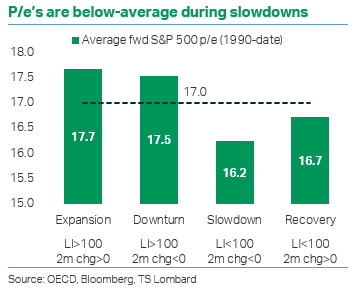 While the fit between nominal GDP and EPS is not bad (64% correlation), it is far from perfect. This should come as no surprise: the former measures the output of the US economy, the latter the profits of US companies, which have a global footprint. This means EPS estimates need to be taken with a pinch of salt. Cognizant of this, we used conservative assumptions for the p/e ratio, at just 1-1½ points below the long-term average and roughly in line with the typical values seen during economic slowdowns, including non-recessions (see chart).
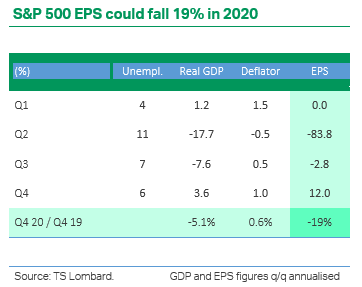
We have tried to refine our model for this note and incorporate not only nominal GDP but also unemployment, for which our economists also provide forecasts. This approach improves the fit of EPS to the two factors, albeit not by much (70% correlation). With our set of assumptions, this approach produces a smaller EPS decline of 19% (see table).
There is still more downside than upside. The key point is that while forecasts are inherently inaccurate, the S&P 500 continues to trade well above reasonable fair value estimates – whether they be 1600-1800 (30% EPS fall) or 1800-2000 (19% EPS fall). This means that despite the 30% drop in prices from the peak, there still is more downside than upside risk in equities.
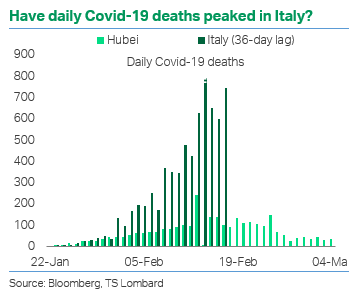
- What signposts should investors look for to spot the bottom? The S&P trading at or below fair value would be a strong signal, but there is no guarantee that this will happen, given the unprecedented policy response (and what is still to come). The next best signpost is trends in the virus epidemic. Italy’s new reported cases and deaths have been showing signs of topping out. Our policy analysis suggests, if this trend is confirmed, lockdowns may soon start to be relaxed as countries move to the next phase of ‘track and test’ (as Korea and China have done).
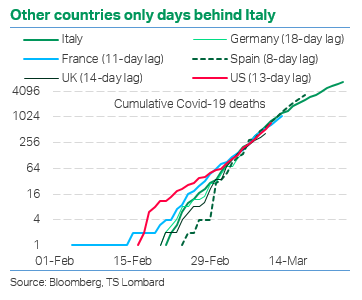
This could provide hope that things will soon start to improve beyond Italy, as other Western counties are on a similar path only with a lag of a few days. Still, it is possible that investors will not be content with this and will want instead to wait until they see tangible evidence of things improving in the US first.
- What will the recovery look like? Even when markets eventually start to recover, investors should not be expecting an immediate return to normal. Our economics teams have published several pieces of analysis (available on request) that suggest a U-shaped recovery is now much likelier than a ‘V’, both for the global economy and financial markets.
 We think that investors are underestimating the impact of second- and third-order effects on growth – i.e. rising unemployment, falling capex and tighter financial conditions. This week’s 3.3 million surge in initial US jobless claims was particularly troubling (though we will probably see a degree of ‘labour hoarding’ in Europe and Japan). Controlled, temporary restrictions during the ‘track and test’ phase also mean that discretionary demand will not return to pre-crisis levels anytime soon.