Client Login
 Contact
If the coming expansion is to be different from the last one, consumers will boost their borrowing relative to income – and there is good reason to believe they will. If they do, real growth gets a lift and so too cyclical inflation, but an inflationary cycle such as a repeat of the1970s remains farfetched. Among the reasons to believe such an upturn is in the making is millennials aging past their student loan burden plus the push from Covid to buy homes. Nothing gets a family spending like filling up a house, and perhaps even an eventual flip to the move-up house. Demographics are critical to our expectation, but so too is high confidence in wage growth. Interest rates will not work to boost borrowing because borrowing rates are high while interest on deposits is stuck at zero, and the Fed is too far gone into its policy to unwind this distortion. Belief in the potential for higher growth calls into question market pricing of forward real yields to the neutral rate from the last expansion, around 50bps or so. There is nothing like increased leverage in the economy to boost real yields.
During the past expansion, the Fed (Bernanke in particular) counted on increased networth from equities to translate into increased borrowing for things – it did not (see chart below left). The Fed still counts on this outcome. In past cycles, households raised and lowered consumer credit (revolving and non-revolving loans) with net worth. An exception was the early00s, when mortgage borrowing drove net worth to record highs. Equities in the last decade had no impact on borrowing to spend. Flat mortgage growth can be tied to many things, including aging demographics, the return of underwriting standards, and the general overbuilding of residential real estate. Millennials were polled as being happy buying experiences rather than real estate. Covid made many realize that they would rather experience living at home with more square footage and fewer people next door. Covid sharply increased homeownership in the 35-to-44 age group and based on historic experience there is further to go.
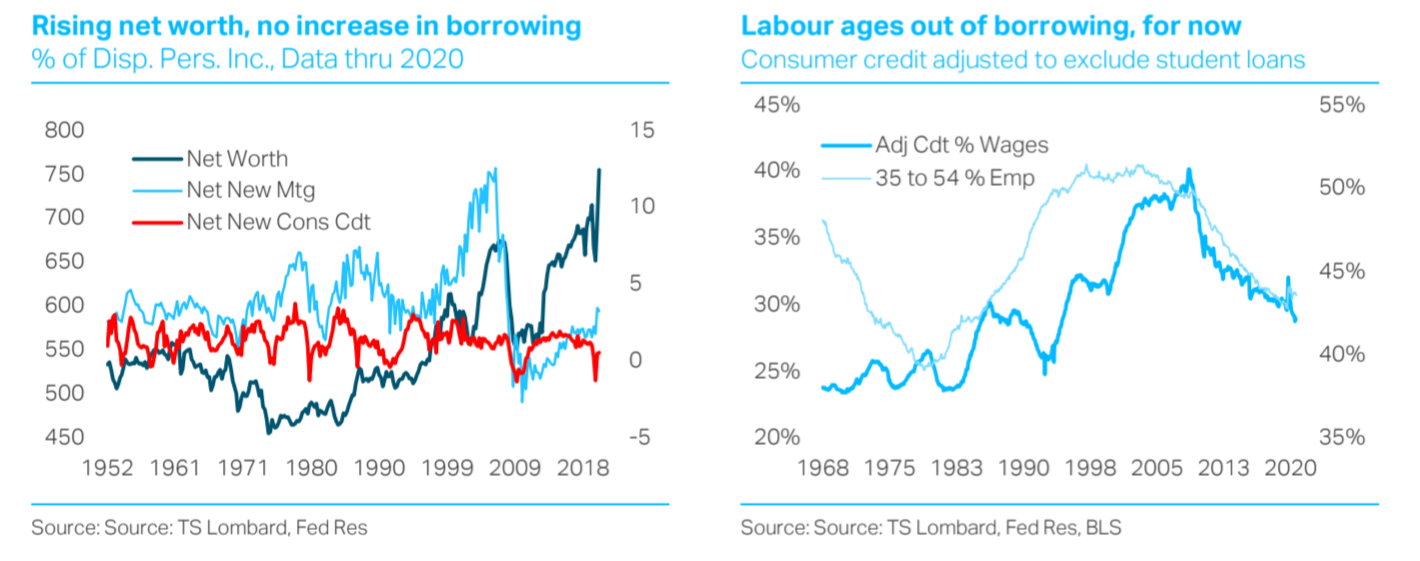
What is more interesting is that consumer credit, adjusted to exclude student loans, declined relative to total wages in the past ten years (chart above right). This reversal comes after several decades of steadily rising consumer leverage. There are numerous factors behind the turn, including the greater spread between the rate charged for personal loans or on credit card debt relative to the yield on a three-month Treasury bill (using this as a proxy for rates paid on consumer bank deposits). Growth in revolving credit fell further below wage growth when the rate spread widened (chart below left). This spread will remain a constraint on credit growth, thanks to distortions from Fed policy, but a longer view of the relationship between consumer credit and wages shows that leverage ties closely to the percent of employees aged 35 to 54 (chart above right).
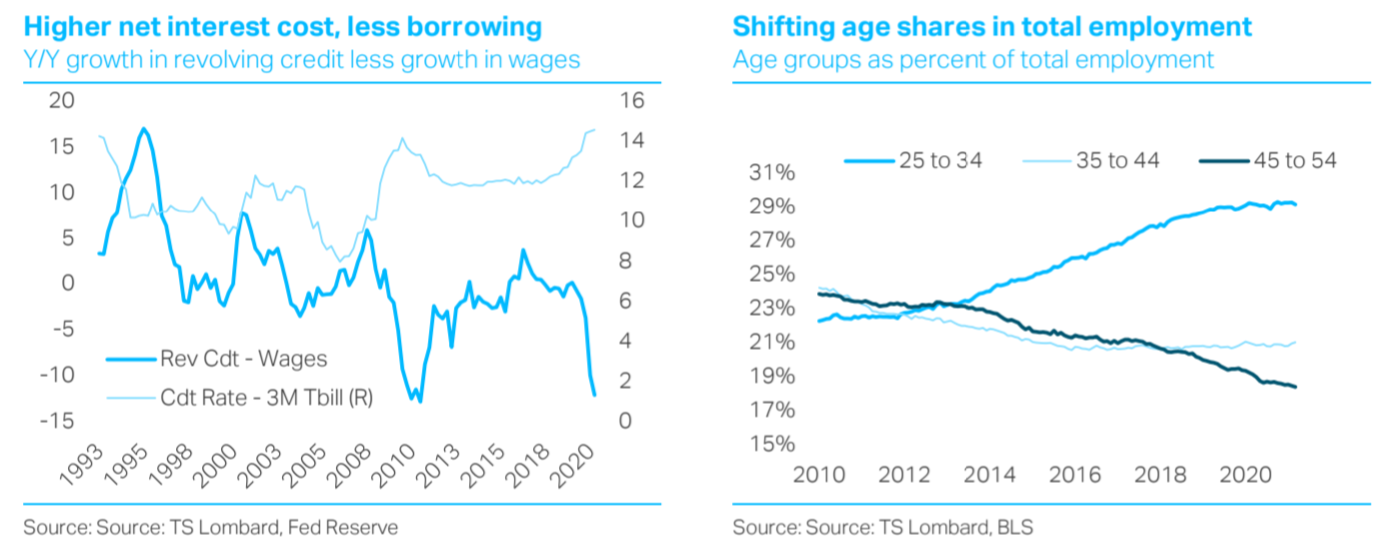
It appears that as the 25-to-34-year-old group ages into the 35-to-44 cohort, consumer credit picks up relative to income, and picks up further as this group ages into the next older cohort. Looking at the chart above right, the front end of millennials should begin to boost the percentage of the 35-to-44 cohort in total employment, while the 45-to-54 looks like it should steady now that the late baby boomers are aging out of this group. The kind of rise in this 35-to-54 group seen from 1980 to 2000 is not the cards, but even a stable to modest uptrend should help change the trend for consumer borrowing relative to wages.
To get current demographics to reflect historic borrowing patterns, student loan debt needs to be paid down and confidence in wage growth must become embedded. The student debt burden for millennials remains large but looks set to become less problematic, a natural course of events as people age into their careers. The rise in wages that comes with seniority reduces the relative burden of student debt by itself. In the chart below left, we show consumer credit relative to liquid assets by generational cohort. Our definition of liquid assets is cash, checkable deposits, time deposits and short-term investments, and money market mutual funds. The cohort data are from the Federal Reserve’s Distributional Financial Accounts. Consumer credit here includes student debt along with revolving and non-revolving credit outstanding. The chart shows that as each group ages, debt relative to cash shrinks. The data start in 1989, when a good portion of Baby Boomer college debt had been worked down. The Gen X numbers are more telling, In 1989, their consumer debt was 233% of liquid assets, it has dropped continuously since then, and is now 40% of liquid assets. Aging in and of itself reduces debt-to-cash ratios (a warning to those who think increased retirement is somehow kicks off leveraged spending). The Silent Generation (Gen X parents), who could pay a year’s tuition in the1950s with the income from waiting tables at a summer resort, dropped their ratio from 11% in1989 to 7% by 2019. Similarly, the ratio for Baby Boomers (Millennial’s parents, although they try to deny it) went from 80% in 1989 to 69% by 1999 to 33% in 2006 and 15% by 2019. There is every reason to believe the Millennial pattern will similarly drop over time, although they admittedly started with a much high ratio – 360% in 2007, now down to 300%.
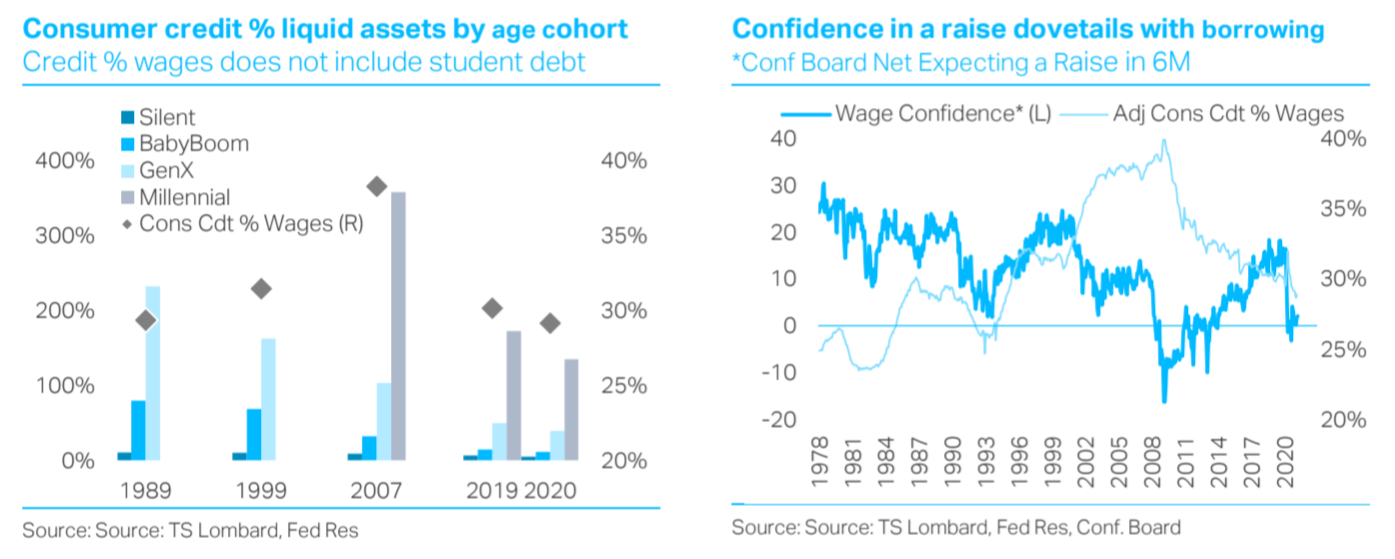
Consumer credit (ex student loans) rises as people age to 54, meaning some retired college debt is swapped for debt to buy things -- wage growth is key to this occurring. When the net percentage of people expecting higher income in six months was averaging around 20%, borrowing excluding student-loans rose in line with the business cycle and demographics. Demographics pulled down borrowing during the most recent decade, but the willingness of consumers to borrow-to-spend was also damaged by the long time until positive wage expectations recovered after the 08-09 recession, and that they never quite recovered to pre-2000 cyclical highs. As of now, the net is zero, just one more reason why not to expect inflation near term. Flat wage expectations plus the large student debt burden means no adding to leverage to spend. And as far as we can tell producers are not taking advantage of high prices to borrow to expand capacity. Inflation is financed – there are no borrowers and near 20% of bank assets are tied up in overnight money.
In sum, demographics are shifting to suggest that consumer borrowing should rise relative to income during the coming expansion – but no repeat of the 1980s-90s. One reason is that student debt, while falling relative to liquid assets, is still much higher than it was for prior generations at this stage of their working careers. This leaves better expectations for wage growth as key to unlocking a generational demand to leverage to accumulate physical assets. Our guess is that leverage does rise in the coming years, a reversal of the past decade, but the pace will be decidedly muted. Even a muted pace is, however, enough of a change from 2010-19 to give the coming upturn a little more lift and a bit more of an inflationary tilt – we emphasize “a bit more”. Forward markets are not pricing this better outcome.