Client Login
 Contact
There are any number of ways to dissect the spread between the 7% job openings rate and 3.5% unemployment, but the needed drop in demand’s contribution to current inflation occurs when this spread turns negative. Inflation will lessen should supply chains ever “normalize”, but normalization alone will not return inflation to 2% -- despite the FOMC’s hope that it will. Remember that goods and energy prices ratcheting downwards revives consumer purchasing power still buoyed by low unemployment, high nominal wage growth, and high savings. On the other hand, and there is always at least two, normalized supply chains could, by itself, reduce demand for labour skills that are in short supply in the US if it means reduced frictions to source global labour and capital – including the return of immigrant labour. Nevertheless, no matter how many hands one throws up, there is no shortcut to reducing inflation in the short-term other than an extended period of labour market slack.
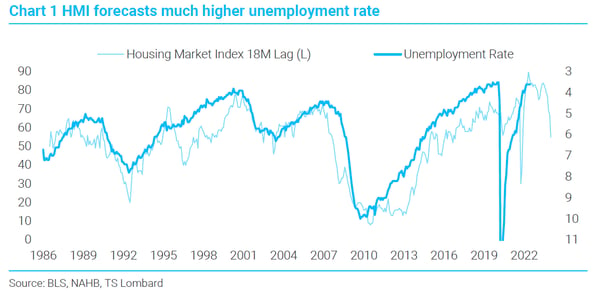
Quantifying the needed slack is another matter. The case can be made that the noninflationary rate of unemployment has shifted higher due to the greater mismatch between job skills needed and those that are available for hire. Based on past dynamics between the job openings rate and the unemployment rate, a 5.5%-6.0% unemployment rate over an extended period is needed to reduce inflation to target. Interestingly, my favourite forward indicator of unemployment, the HMI (housing market index, survey of new homebuilders) forecasts 5.5% in around 18 months.
For whatever reason, the HMI has an excellent track record of forecasting the unemployment rate 18 months. It has guided me to the right unemployment mark through several cycles (Chart 1), including the most recent. There is no reason to believe its prescient powers have evaporated. A simple regression forecasts a 5.5% unemployment rate by the end of next year. Odds are this level is broached sooner than that.
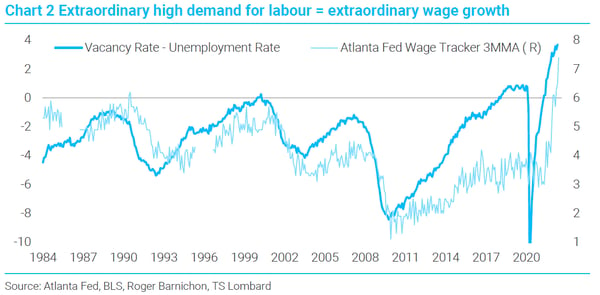
 The relationship between the vacancy/unemployment spread and wage growth and, in turn, inflation is clear, going all the way back to the early 1950s. After 2000, the JOLTS job openings rate is the vacancy rate. For the years prior I am using a time series constructed by Regis Barnichon, an economist at the SF Fed, that builds off the old Conference Board Help Wanted Index to create a proxy for the JOLTS data going back to 1951. What is evident in Chart 2 is that the record spread between vacancy rates and unemployment has delivered an extraordinary acceleration of wage gains (annualized 3MMA from the Atlanta Fed Wage Tracker series).
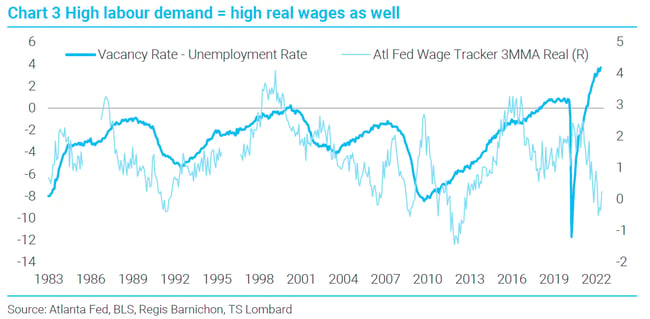
 Lest one think this is only a nominal relationship, it is true for real wages as well (Chart 3). That current inflation is quashing real wage growth suggests that the current top for nominal wage growth has not yet been reached, barring a sharp turn down in the supply-driven portion of current inflation. Either way, the relationship in this chart should normalize in the coming months.
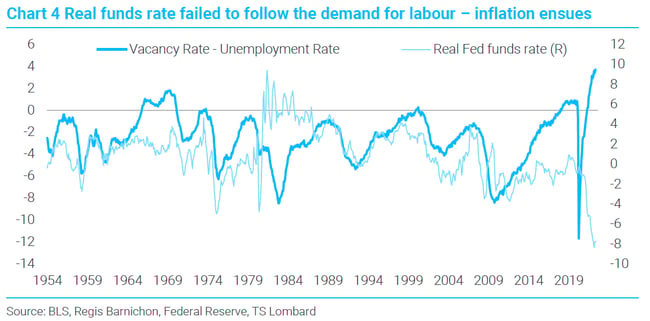
 Taking a long look at this labour demand proxy versus the real Federal funds rate, the spread has rarely been over zero, let alone this high, and the Fed has never been so far behind in its response Whenever this spread has risen towards zero, the funds rate has been raised along with it (Chart 4) – especially in the post-Volcker years. This Fed reaction function broke down in the latter half of the prior decade, yet wage growth didn’t accelerate. What this suggests is that pre- versus post-Covid, the structure of demand for labour has changed to reveal greater mismatches today between skills needed and those available – exacerbated by greater frictions in employing foreign sources of labour and production and limited immigration. To the extent this mismatch is permanent enough, meaning it outlasts the next several years, the noninflationary unemployment rate is now above 3.5% and probably closer to 5%. To get this spread back under zero through a lower job openings rate and higher unemployment, past dynamics between these series delivers a 5.5% unemployment rate results– at a minimum. My guess is the vacancy rate falls faster than unemployment rises in the current cycle.
This, in sum, leads to the bigger question – will the Fed drive the real funds rate high enough and keep it there long enough to sustain sufficient labour slack to in turn, reduce wage growth. My answer is no, given how quickly the Fed pulled the market back from expecting a 100bp rate increase after the June CPI was reported. The tenor of their comments suggests that the “soft landing” outcome still predominates Fed thinking, they are drunk on their own Kool-Aid. The notion that inflation magically falls back to 2% without disrupting labour markets is a fairy tale whose belief, when exercised in policy, translates into inflation during the recovery that follows the coming recession that will be higher than what the economy experienced in the 2010-19 expansion. This is not a policy bias that ends well.