Client Login
 Contact
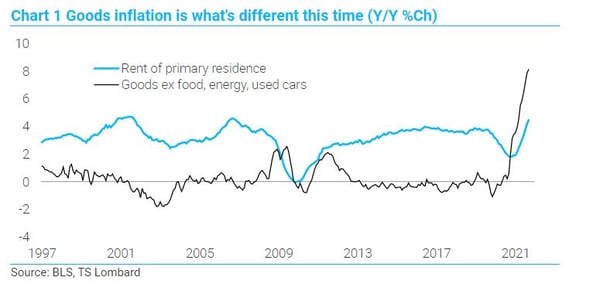
March CPI data came in as expected, driven up by energy and a smattering of services – but goods prices ex food and energy fell 0.4% m/m, and this is key. The “secret sauce” of low core inflation for a generation has been flat to falling goods prices against steadily advancing service prices, rent mostly but not exclusively (think about college tuition!). One month does not make a trend, but the Fed will gladly hope so, wanting to believe goods inflation has finally begun to transit lower –as indicated by the 3.8% m/m drop in used car prices (up 35.3% y/y). As for the surge in energy prices, these surges have proven to be more of a tax on output and consumption than fuel for an inflationary process. The Fed, working more with hope and rhetoric than action, wants to believe the recent ramp in gasoline prices slows growth just as it has in the past. The latest survey from the NFIB suggests as much, and if this view of sharply weaker activity comes to pass, my 1.5% Q/Q forecast for real GDP in Q2 looks more likely than the consensus 3.0%. A first half slowdown with inflation following was always in the cards, as the Covid-boom faded and gave way to the “long-cycle”. Sharply higher energy prices ensure more of a dip before the cycle takes hold. What consequently matters most is where inflation ends up, not where inflation “peaks”. The coming slowdown dents inflation but may not deliver the relief that makes a 3.00%-3.25% funds rate in a year’s time “tight” – and the re-steepening yield curves suggest markets are beginning to believe this as well. Not before summer does the Fed recognize that the world is not going to absolve them of having to jump rates more than planned.
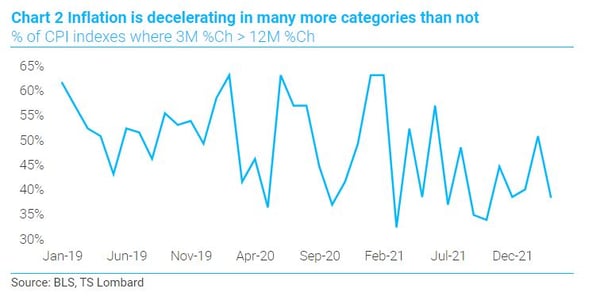
 A silver lining in the March CPI data is the reduced percentage of price categories with three-month growth rates above the 12-month rate. In other words, inflation is decelerating for many more indexes than accelerating (Chart 2), and the broadening was worse a year ago. We will watch in the coming months for whether this deceleration is trend or a one-month anomaly.
 The TS Lombard inflation dashboard is red all over. Most troubling for future inflation is the loan/deposit ratio trending towards red (more at the end of this post).
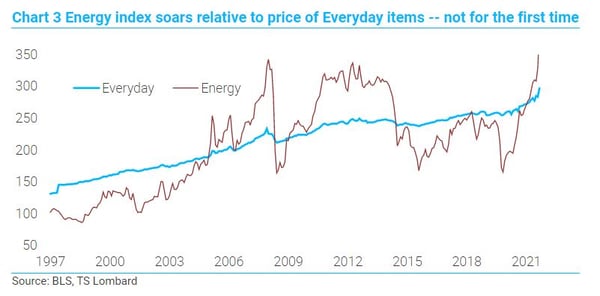
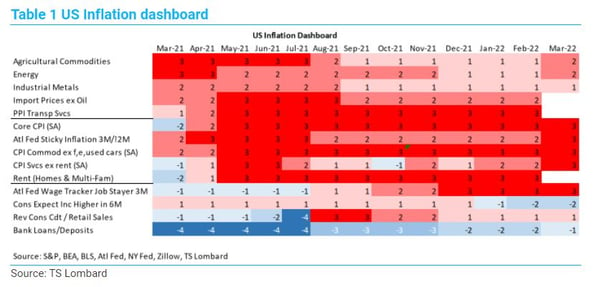 CPI of the “Everyday” soared in March and is running hot on a 1-, 3-, 6-, and 12-month rate of change basis. Energy is a big reason, but it’s jump relative to the everyday (includes energy) was greater in 2008 (1.5 times everyday index vs.1.3 today) and the ratio is about where it was from 2011-14 (Chart 3) when the Fed put on more QE to keep the economy from slipping backwards.
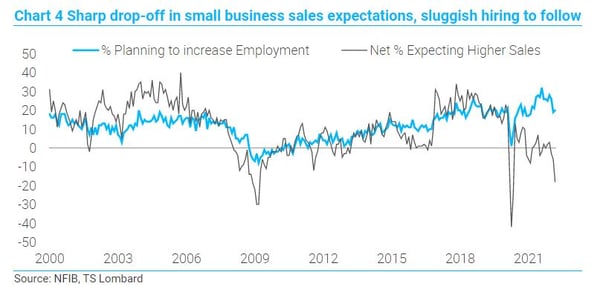
 In the latest NFIB survey, small business makes clear that sales slow in the current quarter. While Q/Q economic growth should not flip negative, the sharp drop in expectations to near recession lows leads to a slowdown in hiring (Chart 4). Wondering how the Fed reacts is premature but given how they believe the labour market is too hot, the hurdle to reverse policy course is higher than usual.
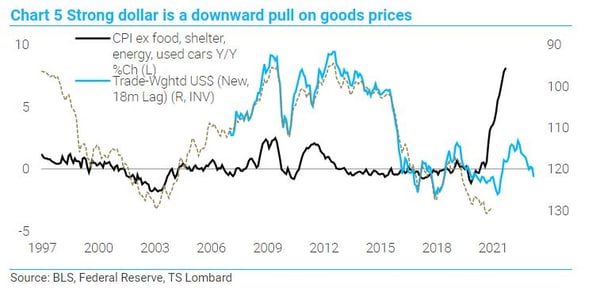
 What happens to core inflation after the slowdown? It will be running less than 8.5%, but it is looking increasingly likely that a 3%-4% range on a m/m basis will be in place at year’s end. On the side of delivering lower inflation is the relationship between the dollar and goods prices (Chart 5). Once supply constraints abate, and given weaker global demand, these two series should tack more in line with historic norms. Deflating goods prices are what the Fed hopes to see, aided by slow Eurasian growth, and it is certainly possible – but a return to a generation of flat goods prices is equally unlikely.
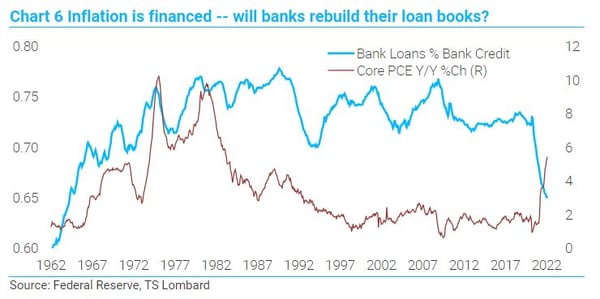
 Loans and banking are, as always, the key to whether inflation stays high relative to pre-Covid levels or not --inflation is financed. It was financed last year by government borrowing massive amounts to inject liquidity into household and small business balance sheets – amounts the Fed monetized 100% by buying the debt. There are no more transfers, so the question is how much private credit expands in its stead – or does a decade of private sector develeraging resume (I think not). Inflation tacks with the trend in bank loans as a percent of total bank credit, and inflation could not resurface with the ceiling on this ratio moving lower (Chart 6). The ratio is now back to mid-60s level because of QE, and if it stays here, no way inflation emerges with a higher profile than pre-Covid. This, along with the dollar, give the Fed comfort that current inflation will prove transitory, not just from a supply-chain perspective. What, however, happens if banks choose to rebuild their loan books without shrinking total credit? Rule changes have, to be sure, made loans a less attractive asset for banks, especially large banks, but banks may still opt to correct current depressed levels. And QT returns reserves to the banks as loanable funds.
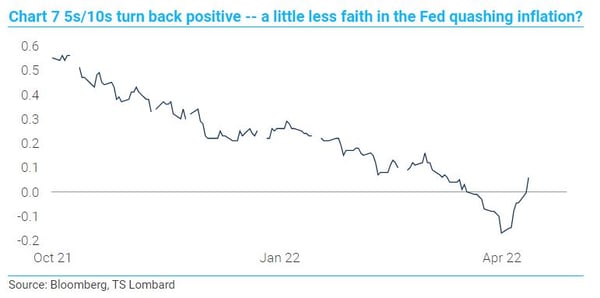
 How do markets see this? I wrote that an inverted real yield curve is precursor to recession. An inverted nominal curve not so much -- it reflects an inflation view, Now that nominal curves have flipped back positive (real curves never inverted), faith in low inflation may be fading --the 5s/10s curve is no longer inverted (Chart 7). The Fed should not take comfort in this re-steepening.
 In sum, March CPI data give comfort that goods price inflation may have begun to reverse – but where inflation ends up is more critical than whether this is the peak. The demand impact from higher commodity prices, specifically energy, slows the economy in Q2, and inflation as well. Slower growth dents inflation but sustained high wage growth and a rebound in bank lending can, among other factors, keep inflation high enough so that the funds rate a year out will be less constraining than now appears. On the supply side, the world has likely changed enough that zero inflation for goods prices over a generation is unlikely to be repeated. The re-steepening of the yield curve, especially 5s/10s, suggests markets are beginning to agree. The Fed remains on track to raise the funds rate 100bp in total at the next two meetings – but 1.25%-1.50% still means real money rates are in deep negative territory. There is a chance Q2 weakness stays the Fed’s hand after June, but the hurdle to stop is very high considering how far rates are from neutral.